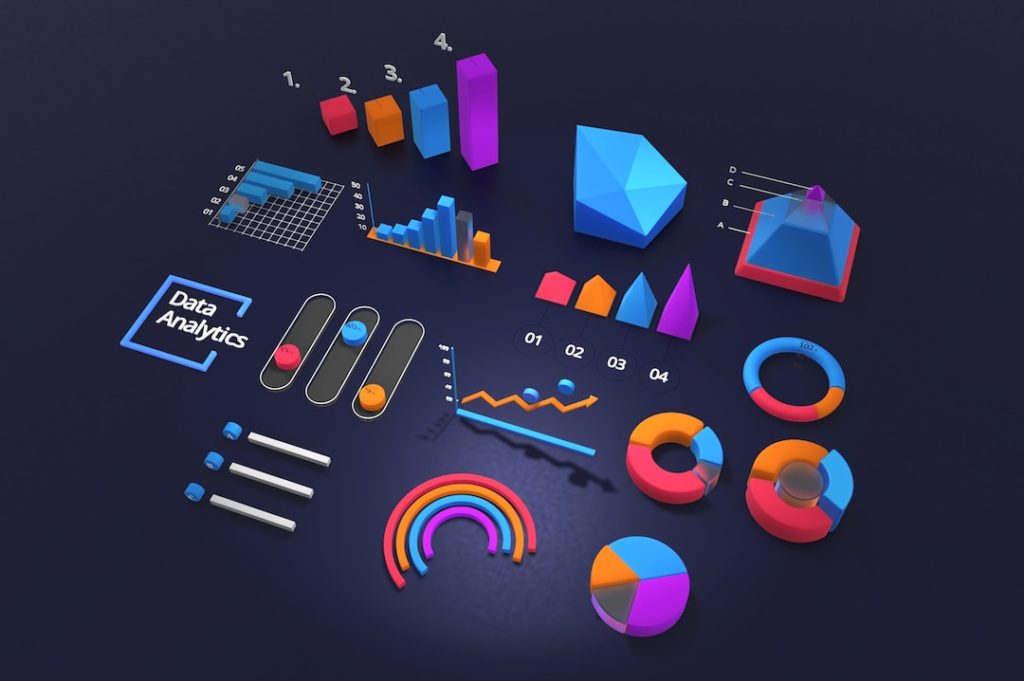
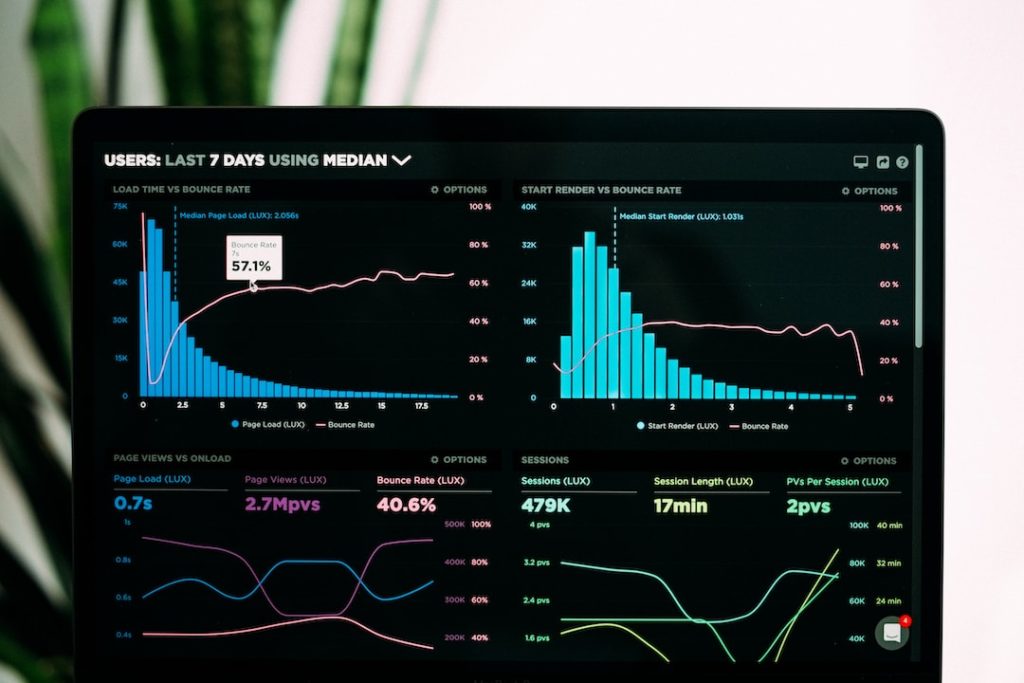
For every business, there’s an ocean of data that can provide invaluable insights if effectively utilized. Among the various methods of data presentation, a bar chart is one of the most commonly used visual tools in the corporate world. Conveying data in a precise and easily understandable manner, bar charts help businesses make informed decisions. This versatile graphical display toolbox has offered solutions to data interpretation problems for centuries. In this article, we will explore the business applications of bar charts. Keep reading to learn more.
Understanding the Impact of Bar Charts in Data Analysis

Businesses have become more data-driven than ever before. Making sense of this immense data can be complex and daunting. This is where data visualization becomes essential. By displaying data in graphical forms, businesses can simplify complex data sets, providing better visibility and enhancing decision-making abilities. Bar charts are a vital part of this process, visually representing categorical data with rectangular bars proportional to the values they represent. Their simplicity makes them a preferred choice for many businesses.
Bar charts enable quick comparison between groups, facilitating quick business decisions. For example, a company may use a bar chart to compare the sales data of various products across different regions. The longer the bar, the higher the value it represents, making it easy to grasp which products are performing best and in which regions. This can assist in prioritizing investment in specific regions or products, defining sales strategies, and planning marketing campaigns.
Bar charts can also effectively track changes over a period, providing businesses with crucial historical data interpretations. A company can use a bar chart to analyze its quarterly performance or track customer demographics year-over-year. This historical perspective allows companies to identify trends, track progress toward goals, and predict future growth. With the data conveniently visualized, businesses can identify where they have been successful and where they need to focus on improvement.
The Versatility of Bar Charts in Business Applications
Bar charts are not restricted to one type of business or industry. They are versatile and can be effectively used in various sectors, from retail and sales to finance and healthcare. A retail business, for instance, could use a bar chart to track the weekly sales of different products, providing insights into which products are trending and which are underperforming. Healthcare providers, on the other hand, can use bar charts to analyze the frequency of various diseases, aiding in public health decisions. In finance, bar charts prove their worth by effectively presenting financial data, allowing for easy comparisons across different periods or between different financial instruments.
Bar charts play a crucial role even in operational and supply chain management. They can graphically represent data related to production volumes, defect rates, and delivery times, to name a few. This information can be vital in identifying bottlenecks, driving process improvements, and enhancing operational efficiency. By visualizing data in a simple bar chart, businesses can make more informed decisions and improve overall productivity.
Utilizing Bar Charts To Achieve Business Growth

Every business aims for growth. However, this journey towards growth needs to be monitored and evaluated, and bar charts can assist in this process. By visualizing performance data, businesses can assess their growth over time, identify areas where they are lagging, and make necessary adjustments. As a result, bar charts can play an integral role in driving a company towards its growth objectives.
Furthermore, bar charts bring transparency and accountability to the business process. Creating a visual representation of performance makes it easier to hold different departments accountable for their results. Employees can understand their performance better, and businesses can make more informed decisions about rewarding high-performers or aiding underperformers.
A bar chart is a versatile, powerful business tool. So whether it’s data analysis, finance, marketing, operations, or strategy, bar charts can play a crucial part in enhancing business decision-making and driving growth.


